MEGHA JAIN
About LinkedIn GitHub Email
Projects
-
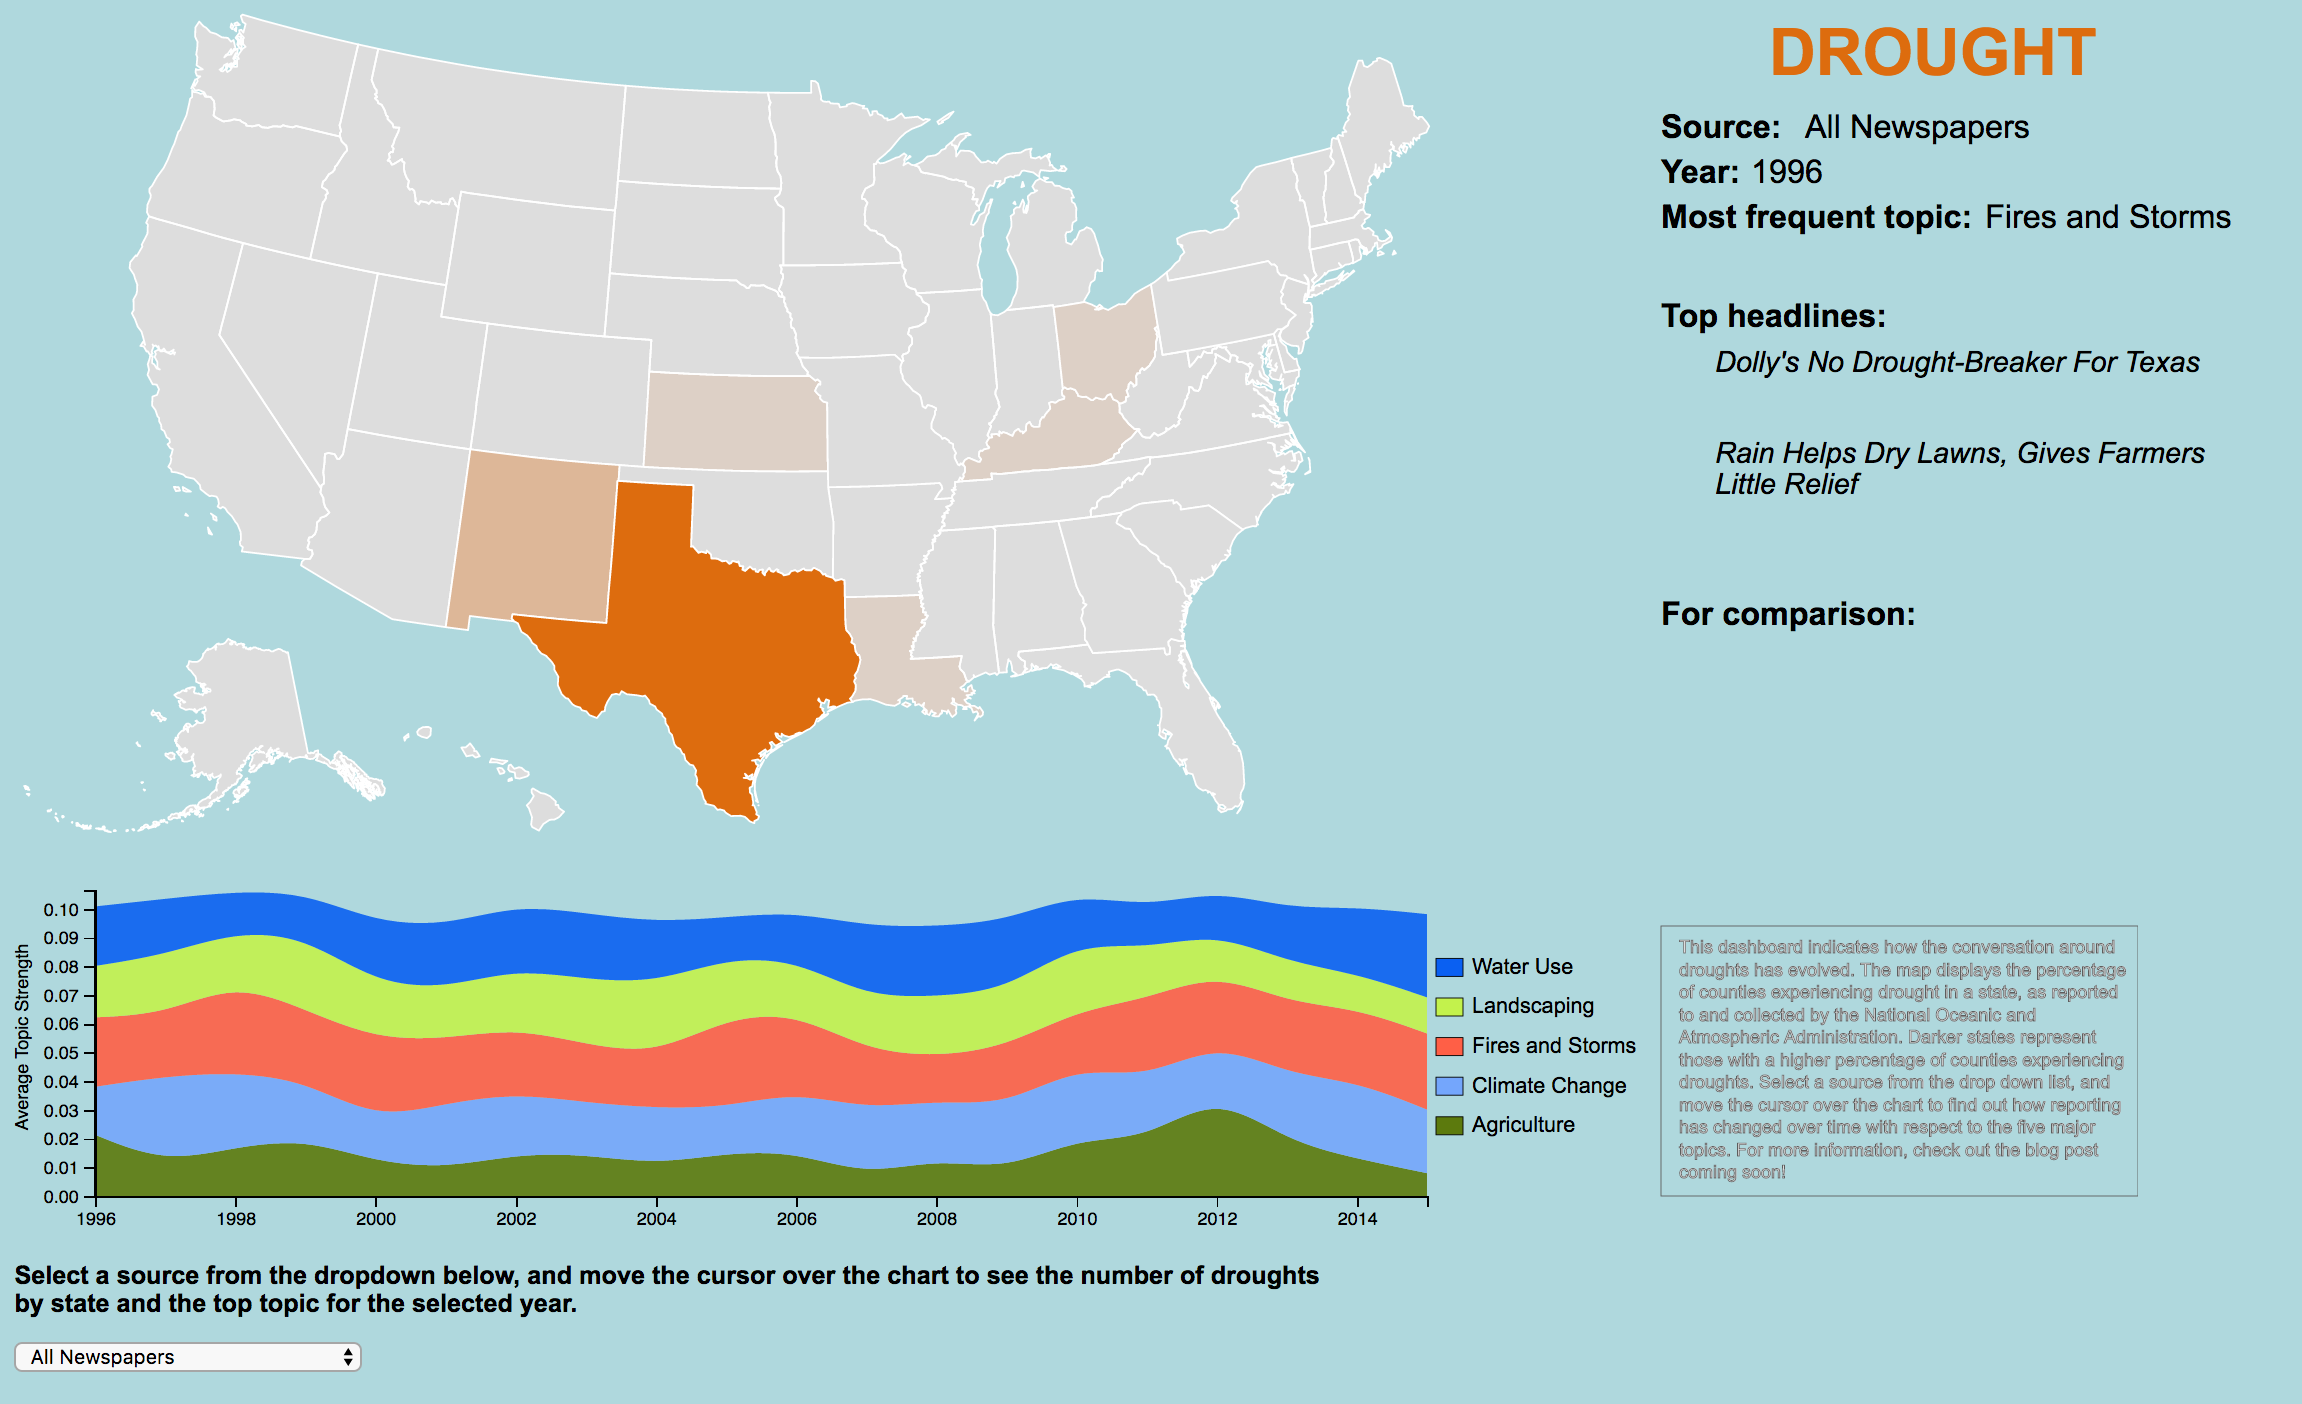
- Tracking Media Coverage on Climate Change
-
Tools:
scrapy, selenium, pandas, MIT NER, scikit-learn, flask, D3
-
A d3 interactive dashboard, this project tracks how media coverage on climate change has evolved over time and across the country using natural language processing. Using articles scraped from 12 news sources, the project focuses on reporting during extreme weather events, specifically droughts, hurricanes, tornadoes, and flooding and finds the dominant topics for each event. The dashboard shows a stacked area chart of each topic's strength over time, a content box with the top headlines for the strongest topic in a given year, and a map indicating the number of that type of event in a given year.
-
- AccessArt
-
Tools:
scrapy, selenium, pandas, textblob, scikit-learn, flask, SQLite
-
The motivation for this project came from a friend interested in further exploring New York's art scene. This flask app displays images from current exhibits and, upon clicking on an exhibit, suggests 3 related exhibits. Given the lack of publicly accessible feedback on exhibits, the suggestions are based on a content-based filtering system that analyzes exhibit descriptions, scraped from websites such as Artbeat and Artsy, using NLP.
-
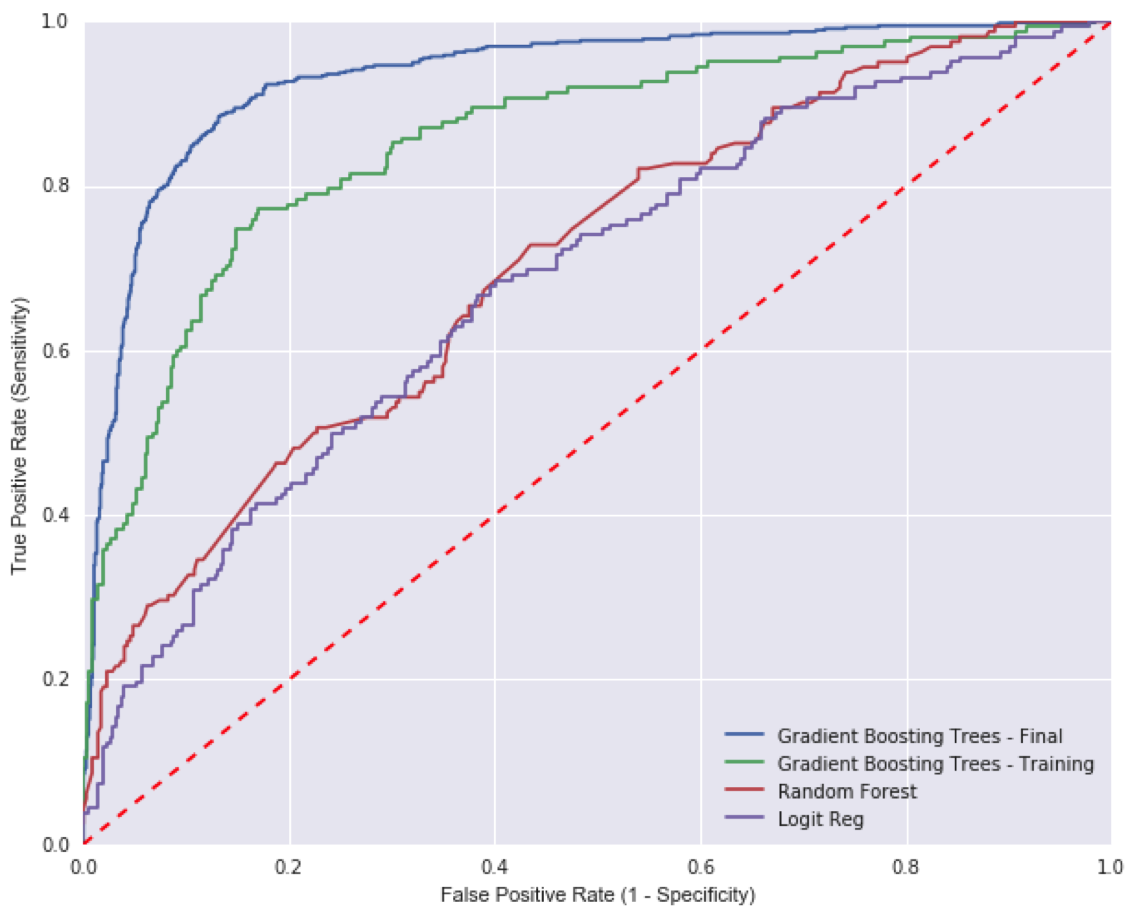
- Predicting FEMA Declarations
-
Tools:
scikit-learn, pandas, seaborn
-
This project explored classification algorithms through trying to predict whether a weather event will be declared a disaster by FEMA. The aim is to help counties better predict disasters and request aid in advance while helping FEMA plan for aid provision. Data sources included weather data from CDIAC, extreme weather event data from the NOAA, and socioeconomic and infrastructure data from the Census and the American Community Survey. The final model used is gradient boosting trees, which performed well with 88% recall.
-
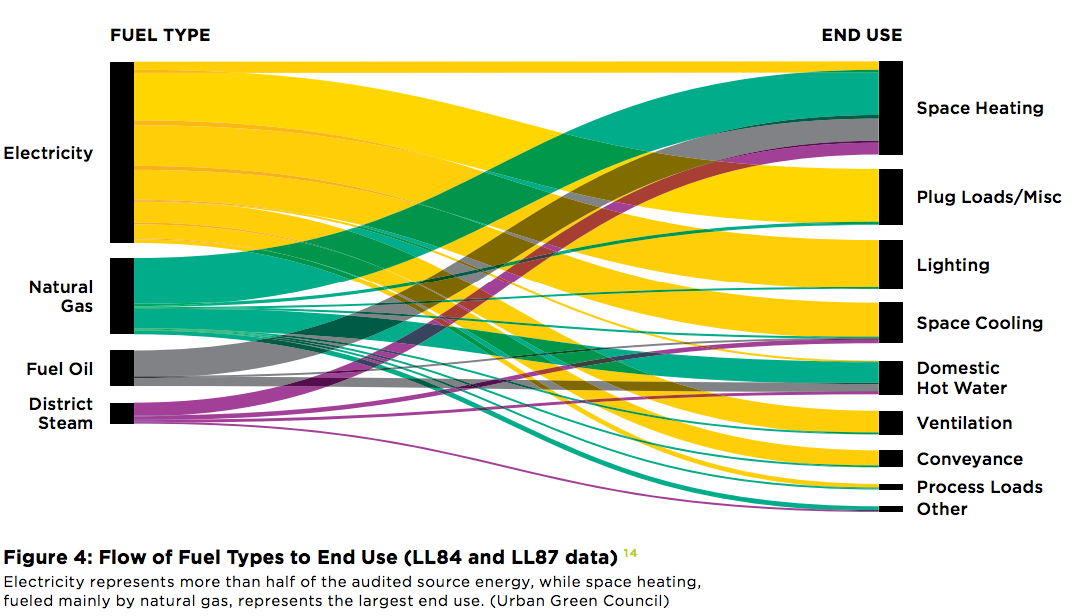
- New York City's Energy and Water Use 2013 Report
-
Tools:
pandas, seaborn
-
This report, produced by the Urban Green Council, the Mayor's Office of Sustainability and NYU's Center for Urban Science and Progress, combines New York City's benchmarking data with newly collected audit data to better understand how much and how energy is used in New York City's largest buildings. My contribution, while at Urban Green, included devising and refining cleaning methodologies for the benchmarking and audit datasets and developing content and graphics.
-
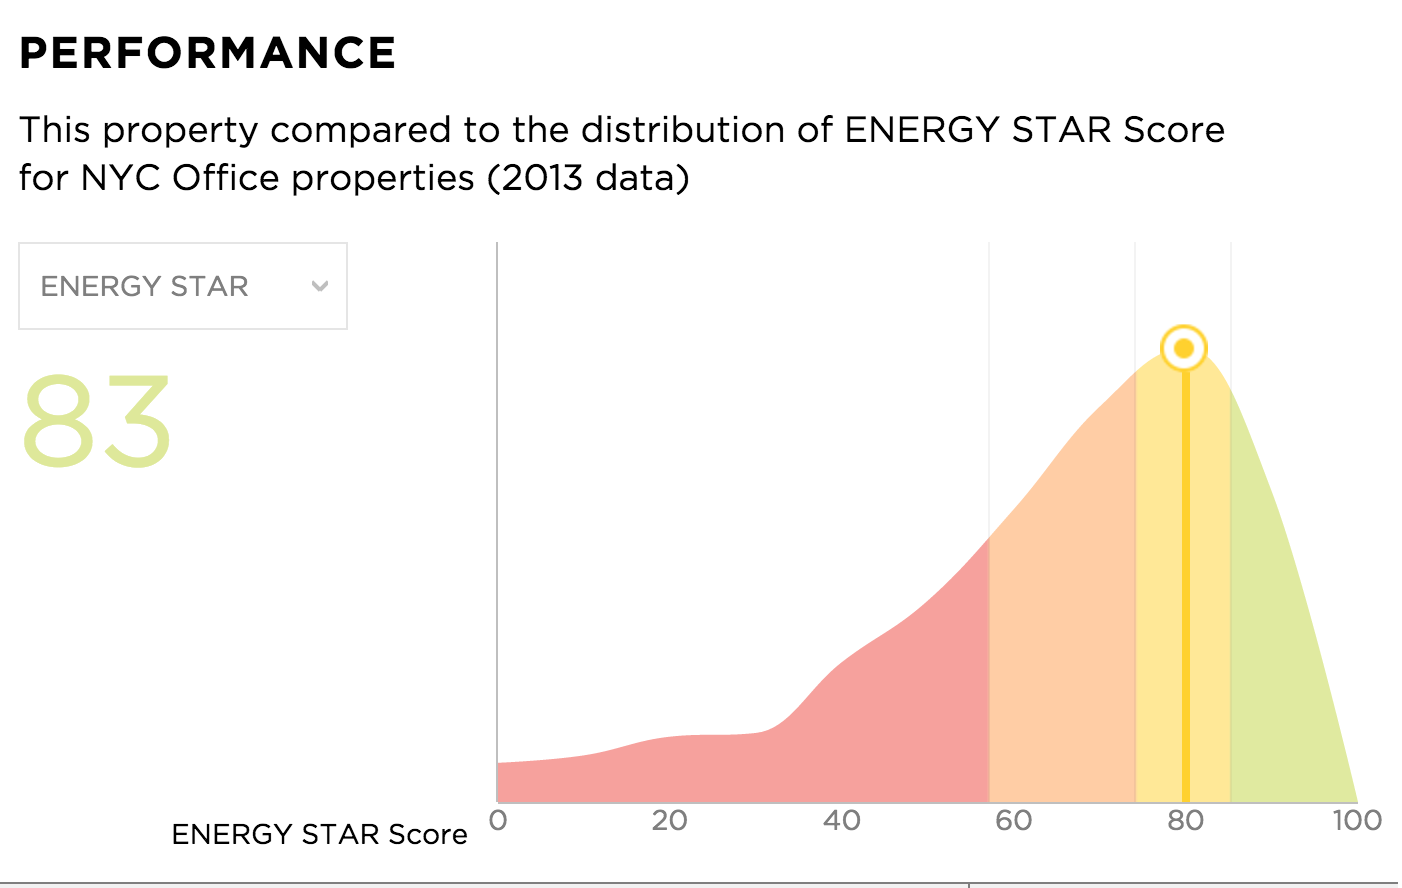
- Metered
-
Tools:
pandas, seaborn
-
While at Urban Green, we developed a website to display the benchmarking data documenting NYC's largest buidings' energy and water use in a lay-friendly manner. My contributions here included cleaning and preparing the data and graphics for the website developers.